Disclaimer: The information presented does not constitute financial, investment, trading, or other types of advice and is solely the writer's opinion
- Market structure on daily and lower timeframes was bearish
- A bounce from $220 was in progress, but faced resistance at $240
There has been a lot of fear around Binance in recent weeks, following FTX's implosion. These fears were clearly visible on the price charts of exchange token Binance Coin [BNB].
Moreover, CryptoQuant's recent report on Binance's Proof-of-Reserve highlighted that their liabilities were 97% collateralized by the exchange reserves.
Read Binance Coin's [BNB] Price Prediction 2023-2024
This data suggested that Binance did not exhibit FTX-like behavior. Their report was more to determine that Binance did indeed possess the amount of BTC they claimed they did, and not to curry positive sentiment about the exchange.
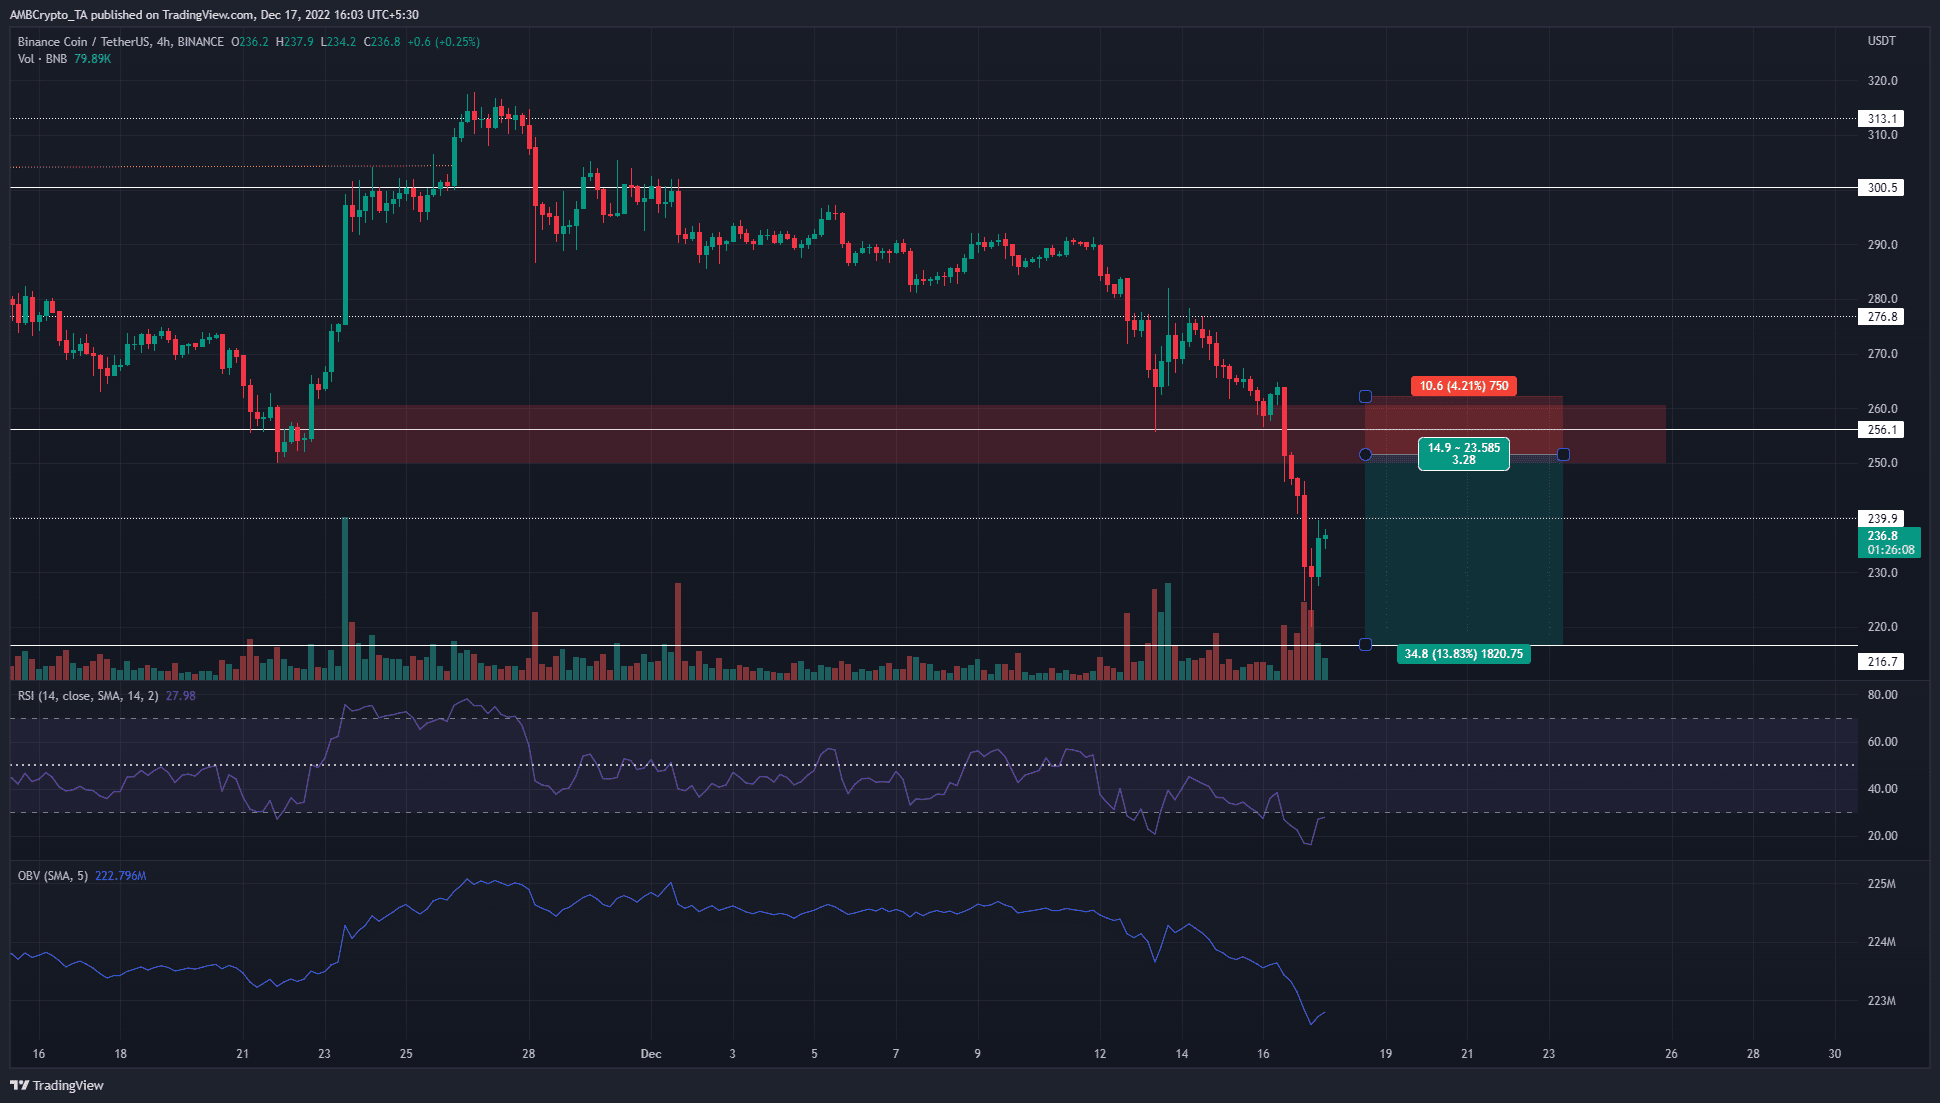
Binance Coin crashes beneath the $250 mark, bulls skirmish to regain $240

Source: BNB/USDT on TradingView
The price charts were enormously skewed in favor of the bears over the past week. In late November, BNB rose to test the $315 level of resistance and faced rejection. Till 11 December, the price embarked on a gradual downtrend, which looked to be more of a pullback before another push.
However, this idea was quickly invalidated when Binance Coin dived beneath the $276 level of support. It retested the same as resistance on 14 December. The area above marked in red represented a bullish order block on the 12-hour chart.
During the drop, the area yielded one positive reaction, forcing a bounce to $276. However, the downtrend was too strong, and this bullish order block was flipped to a bearish breaker.
A retest of this breaker could offer shorting opportunities, targeting the $216 level that served as support back in July. Invalidation of this bearish notion would be a move back above the $260 mark and the highlighted breaker.
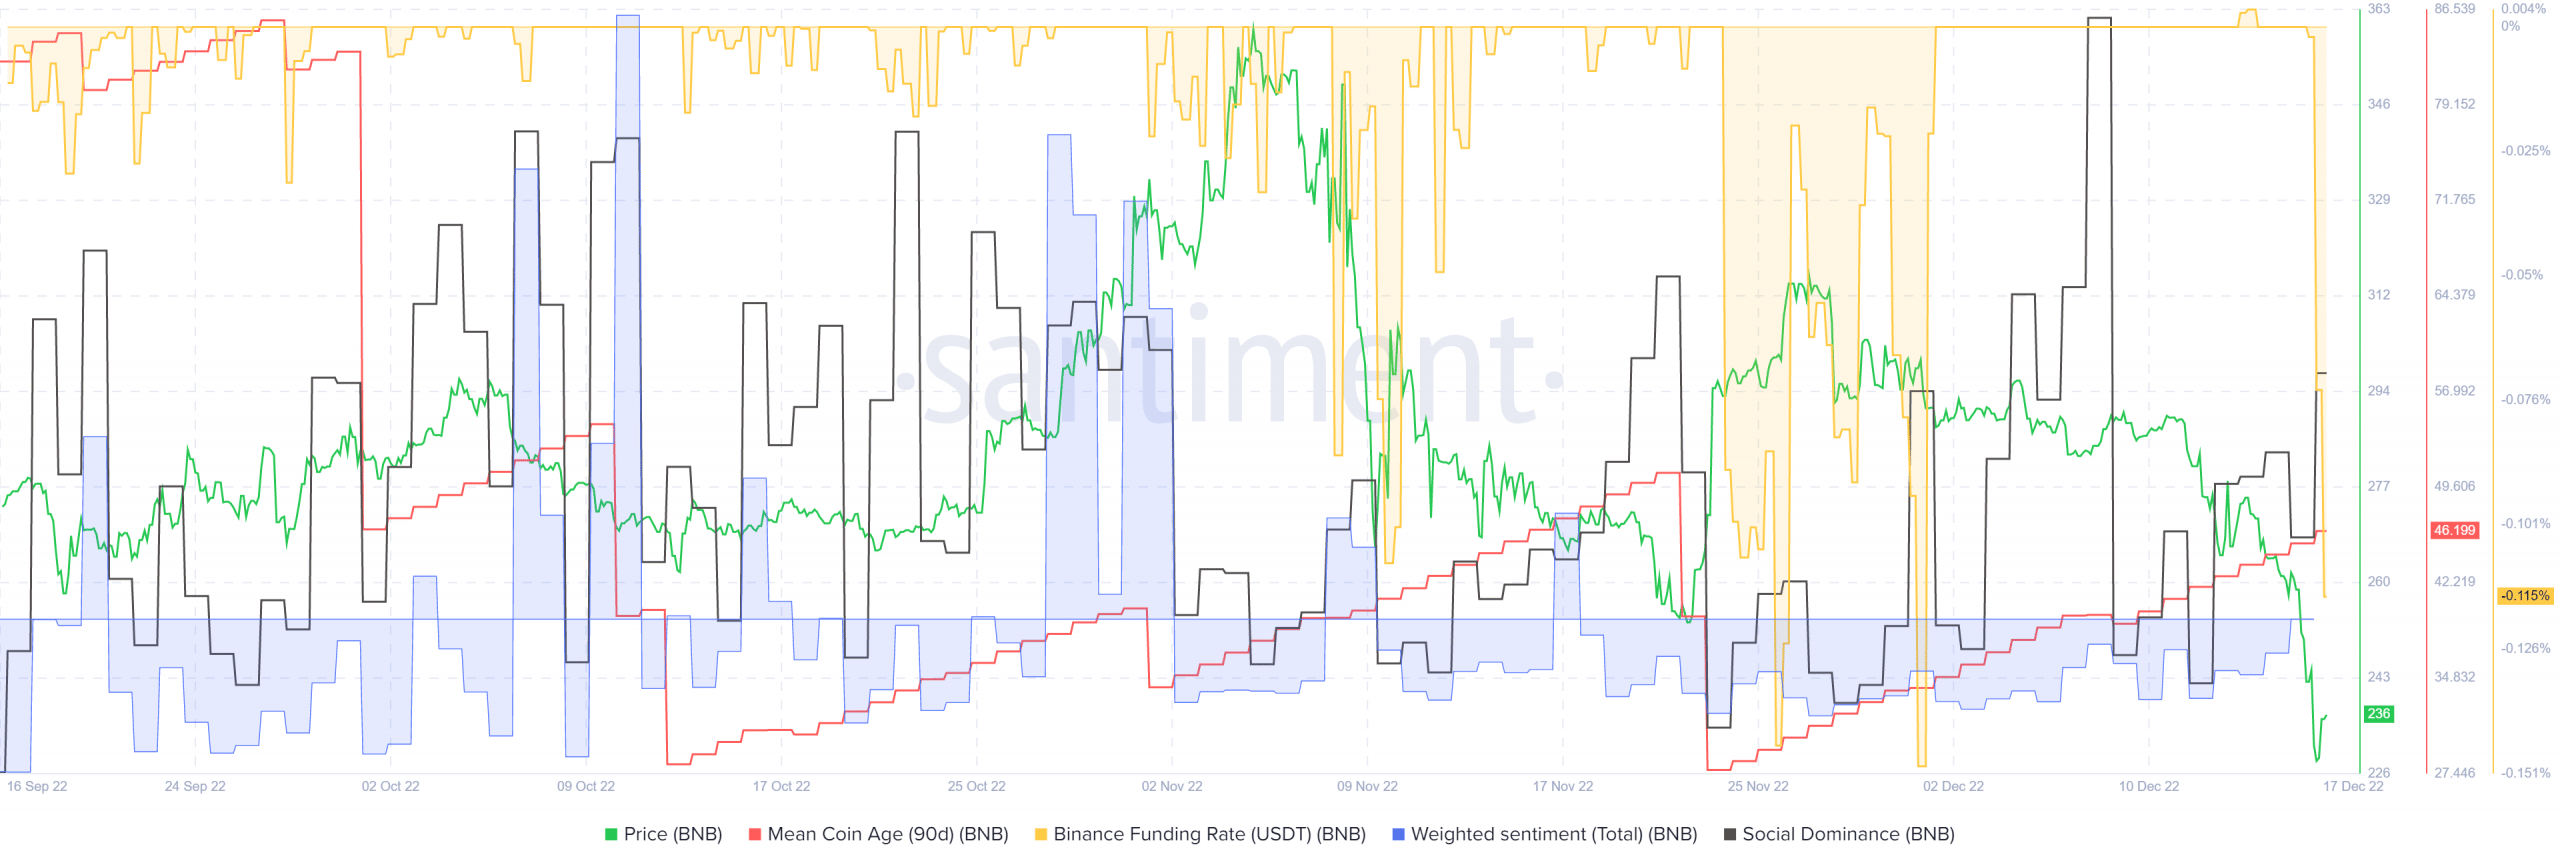
Mean coin age on the rise, but funding rate plummeted to show bearish sentiment
The sharply falling funding rate meant that short-selling was becoming an overcrowded trade. While this showed strong bearish momentum from futures traders, it also meant that a move upward could force these shorts to close at a long and fuel further rallies.
Such a move into the $250 area, if materialized, could be utilized by the bears. However, the 90-day mean coin age has been in a steady uptrend since late November.
This suggested that BNB tokens did not see heightened activity on-chain, which normally occurred alongside intense selling. On the social front, weighted sentiment was negative in the past week. Social dominance also shot as far north as 10.8% earlier this month, but has dropped since then.
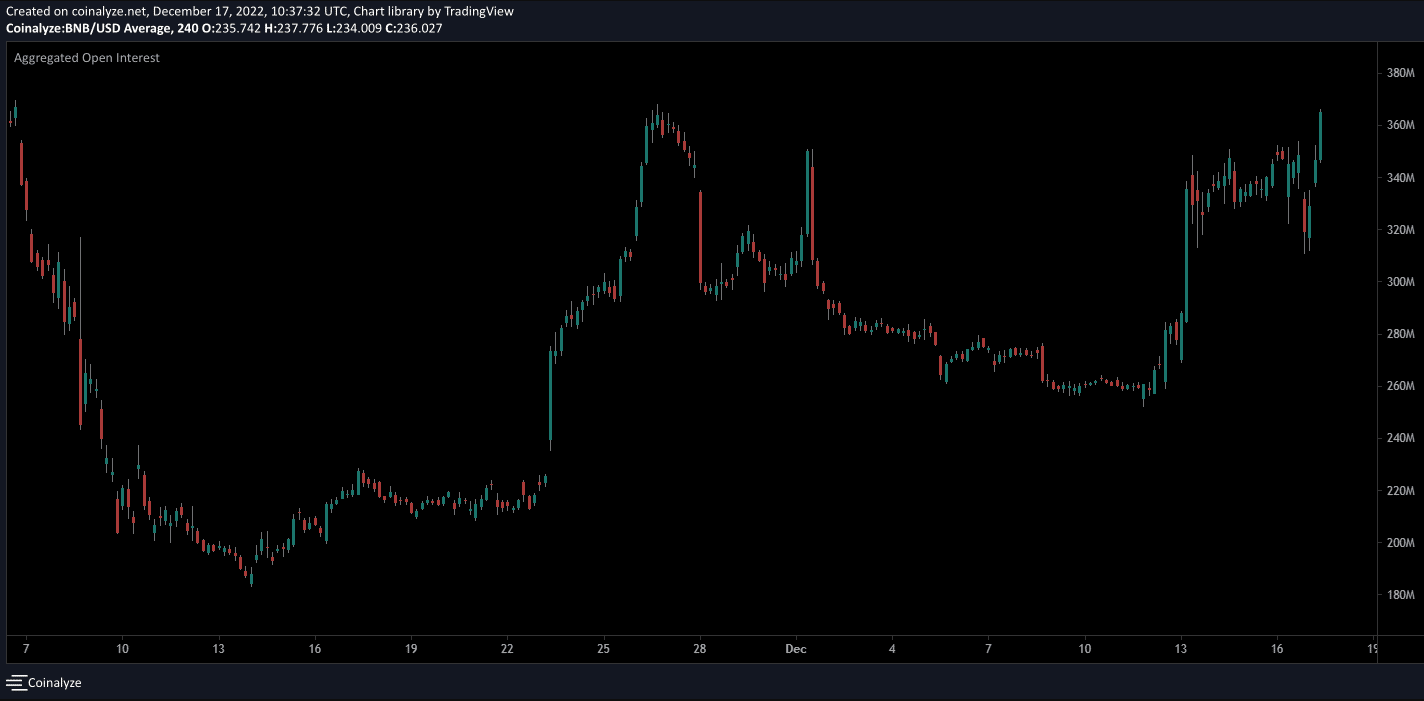
The open interest metric rose strongly since 12 December. This was the day when BNB dropped from the $290 mark, showing that short positions were likely opened. Thus, the selling pressure seen in the futures market was highlighted.
The rise in OI, alongside falling prices, underscored the strong bearish sentiment behind BNB yet again.


No comments:
Post a Comment