An analyst has pointed out two demand zones that could be important for Bitcoin. Here's what could be next for BTC based on these supply walls.
Bitcoin On-Chain Support And Resistance Levels Could Provide Hints For What's Next
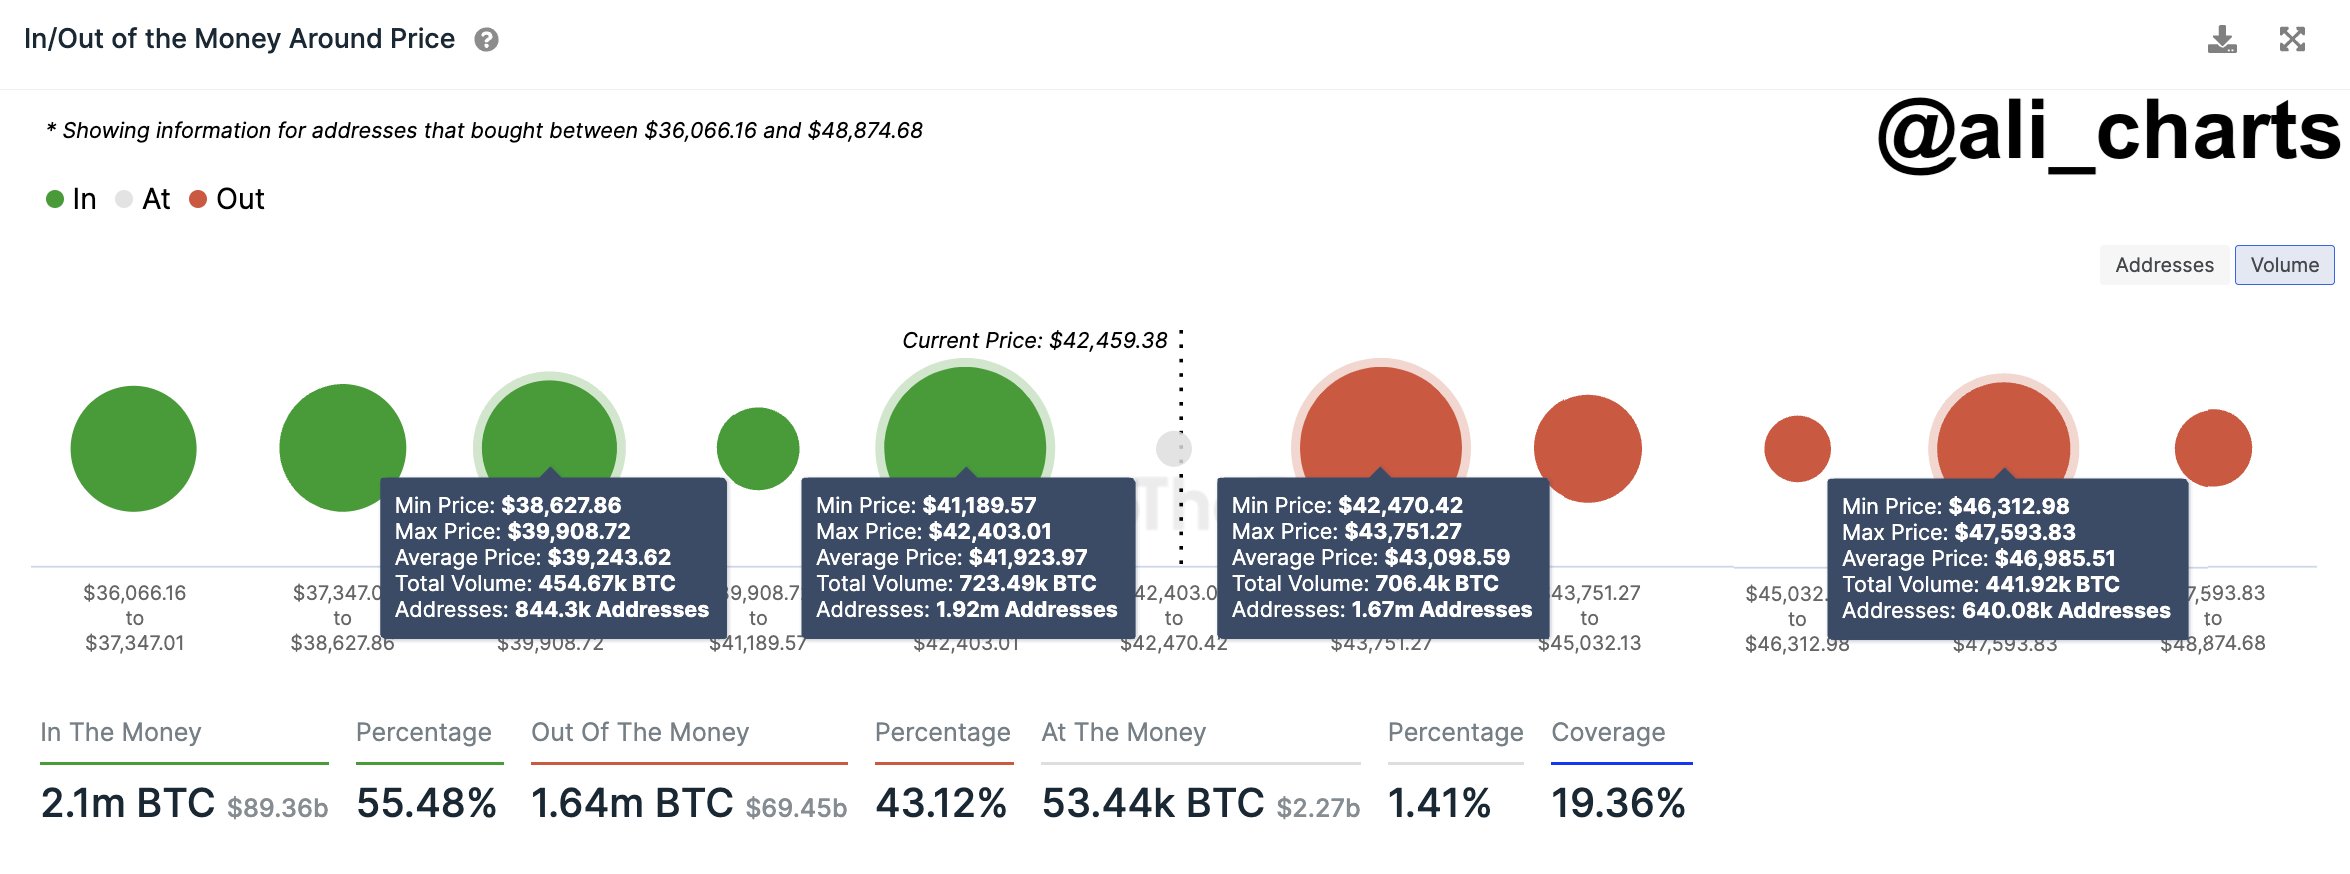
As explained by analyst Ali in a new post on X, Bitcoin has recently been floating between two major supply walls of the asset. "Supply wall" refers to the amount of Bitcoin that addresses acquired in any given price range.
The chart below shows what the different supply walls look like for BTC for the ranges around the current spot price of the cryptocurrency.

The data for the on-chain support and resistance levels | Source: @ali_charts on X
In the above graph, the size of the dot represents the number of coins the investors bought inside the corresponding range. It would appear that the $41,200 to $42,400 and $42,400 to $43,700 ranges are notably heavy with supply.
To be more particular, the former range saw 1.92 million addresses buy a total of 723,490 BTC, while the latter witnessed an accumulation of 706,400 BTC from 1.67 million holders.
For any investor, their acquisition price or cost basis is an important level, as when the asset's price retests, their profit-loss situation can potentially change. As such, the holders are more likely to show some reaction when such a retest takes place.
Naturally, just a few investors displaying a reaction won't affect the market, but if many addresses share their cost basis inside a narrow range, the reaction from a retest could end up being sizeable.
Because of this reason, major supply walls (like the two mentioned just earlier) can end up being important retests for Bitcoin. Generally, the asset is more likely to feel support when this retest happens from above, while the coin could feel some resistance when it's from below.
These effects seem to follow because of how investor psychology tends to work; an investor who was in profit before the retest might want to take a further gamble, believing the same price range to be profitable again. Such buying is the source of the support.
Similarly, loss holders would be tempted to sell when the price reaches their break-even point, as they may not want to risk holding further as the coin could go back down, pulling them underwater again.
Bitcoin has been trading between two major supply walls during its recent consolidation. "A sustained close beyond these bounds will help gauge BTC's trend," notes Ali.
The chart shows that the next large resistance ahead is between $46,300 to $47,600, while $38,600 to $39,900 carries the next major support below. "A breakout above resistance may propel BTC towards $47,600, while a dip below support might lead to a correction down to $38,600," explains the analyst.
BTC Price
Bitcoin is trading around the $42,700 mark as it continues its recent sideways movement.

Looks like the asset's price has been stuck in consolidation during the last few days | Source: BTCUSD on TradingView
Featured image from Shutterstock.com, charts from TradingView.com, IntoTheBlock.com
Disclaimer: The article is provided for educational purposes only. It does not represent the opinions of NewsBTC on whether to buy, sell or hold any investments and naturally investing carries risks. You are advised to conduct your own research before making any investment decisions. Use information provided on this website entirely at your own risk.
Source: NewsBTC.com

No comments:
Post a Comment